DevTrack
Habits and productivity monitoring that allows developers to analyze their work patterns and optimize their daily performance through interactive dashboards.

I built DevTrack to solve a personal and technical need: to measure programming time, analyze my habit metrics, and calculate financial earnings, but without relying on manual timers, without noisy interfaces, and without sending my data to third-party servers.
This document details the architecture, models, and inner workings of the project. I designed it by dividing the solution into two main parts: an “engine” that lives directly inside Visual Studio Code (vscode-extension), and a presentation portal or promotional website (landing-page).
Below, I explain how the tool works inside and the technical decisions I made to build it.
1. The Problem and the Approach
Most time-tracking tools require manual actions (start/pause) and feature cluttered, colorful interfaces that compete for visual attention within the editor.
I decided to solve this based on three technical pillars:
- Event Automation: Use the native VS Code API to silently infer user activity.
- Local Privacy: Leverage VS Code’s
globalStateso that all data resides exclusively on the user’s machine. - Integrated Aesthetics: Use monochromatic CSS variables (
--vscode-descriptionForeground) so that the dashboard blends with the editor’s theme, avoiding “notification-hell”.
2. Extension Architecture (VS Code)
To ensure maintainable and scalable code, I structured the vscode-extension directory under the principles of Domain-Driven Design (DDD) using Vertical Slicing.
Core Models and Services (src/core/)
Shared services handle the cross-cutting infrastructure of the extension:
StorageManager: This is the persistence layer. Instead of relying on heavy local databases, it encapsulates access to VS Code’sglobalState, ensuring efficient writes and data isolation.FormattingManager: Centralizes date and currency formatting. Since time tracking strictly depends on medianight resets, I used the nativeIntlAPI with theen-CAlocale to generate consistent dates (YYYY-MM-DD) that respect the user’s dynamic time zone.SoundPlayer: For real-time earnings milestones, I implemented audio notifications (like a coin sound) by delegating to OS commands (afplayon macOS,powershellon Windows,aplayon Linux). If it fails, it uses the native UI of the editor as a fallback.DashboardManager: Renders the main view using aWebviewPanel. I secured the view using restrictive Content Security Policy (CSP) policies that only allow specific CDN scripts and Google fonts (Space Grotesk, Geist).
Tracking Engine: The Orchestrator (src/features/tracker/)
The technical heart of DevTrack is the “Observer” pattern implemented through the TrackingOrchestrator.
Instead of having multiple cycles listening to independent events chaotically, the orchestrator:
- Subscribes to fundamental API events (e.g.,
onDidChangeActiveTextEditor,onDidChangeTextDocument,onDidChangeWindowState). - Maintains an internal cycle (“tick”) of 1 second.
- Calculates inactivity. If the user stops interacting, it autonomously stops the cycle.
- Relays this “tick” to a set of independent Trackers that implement a common interface.
Analytics Modules (Habits and Time)
I implemented specialized modules (Trackers) that decouple and process the orchestrator’s relay:
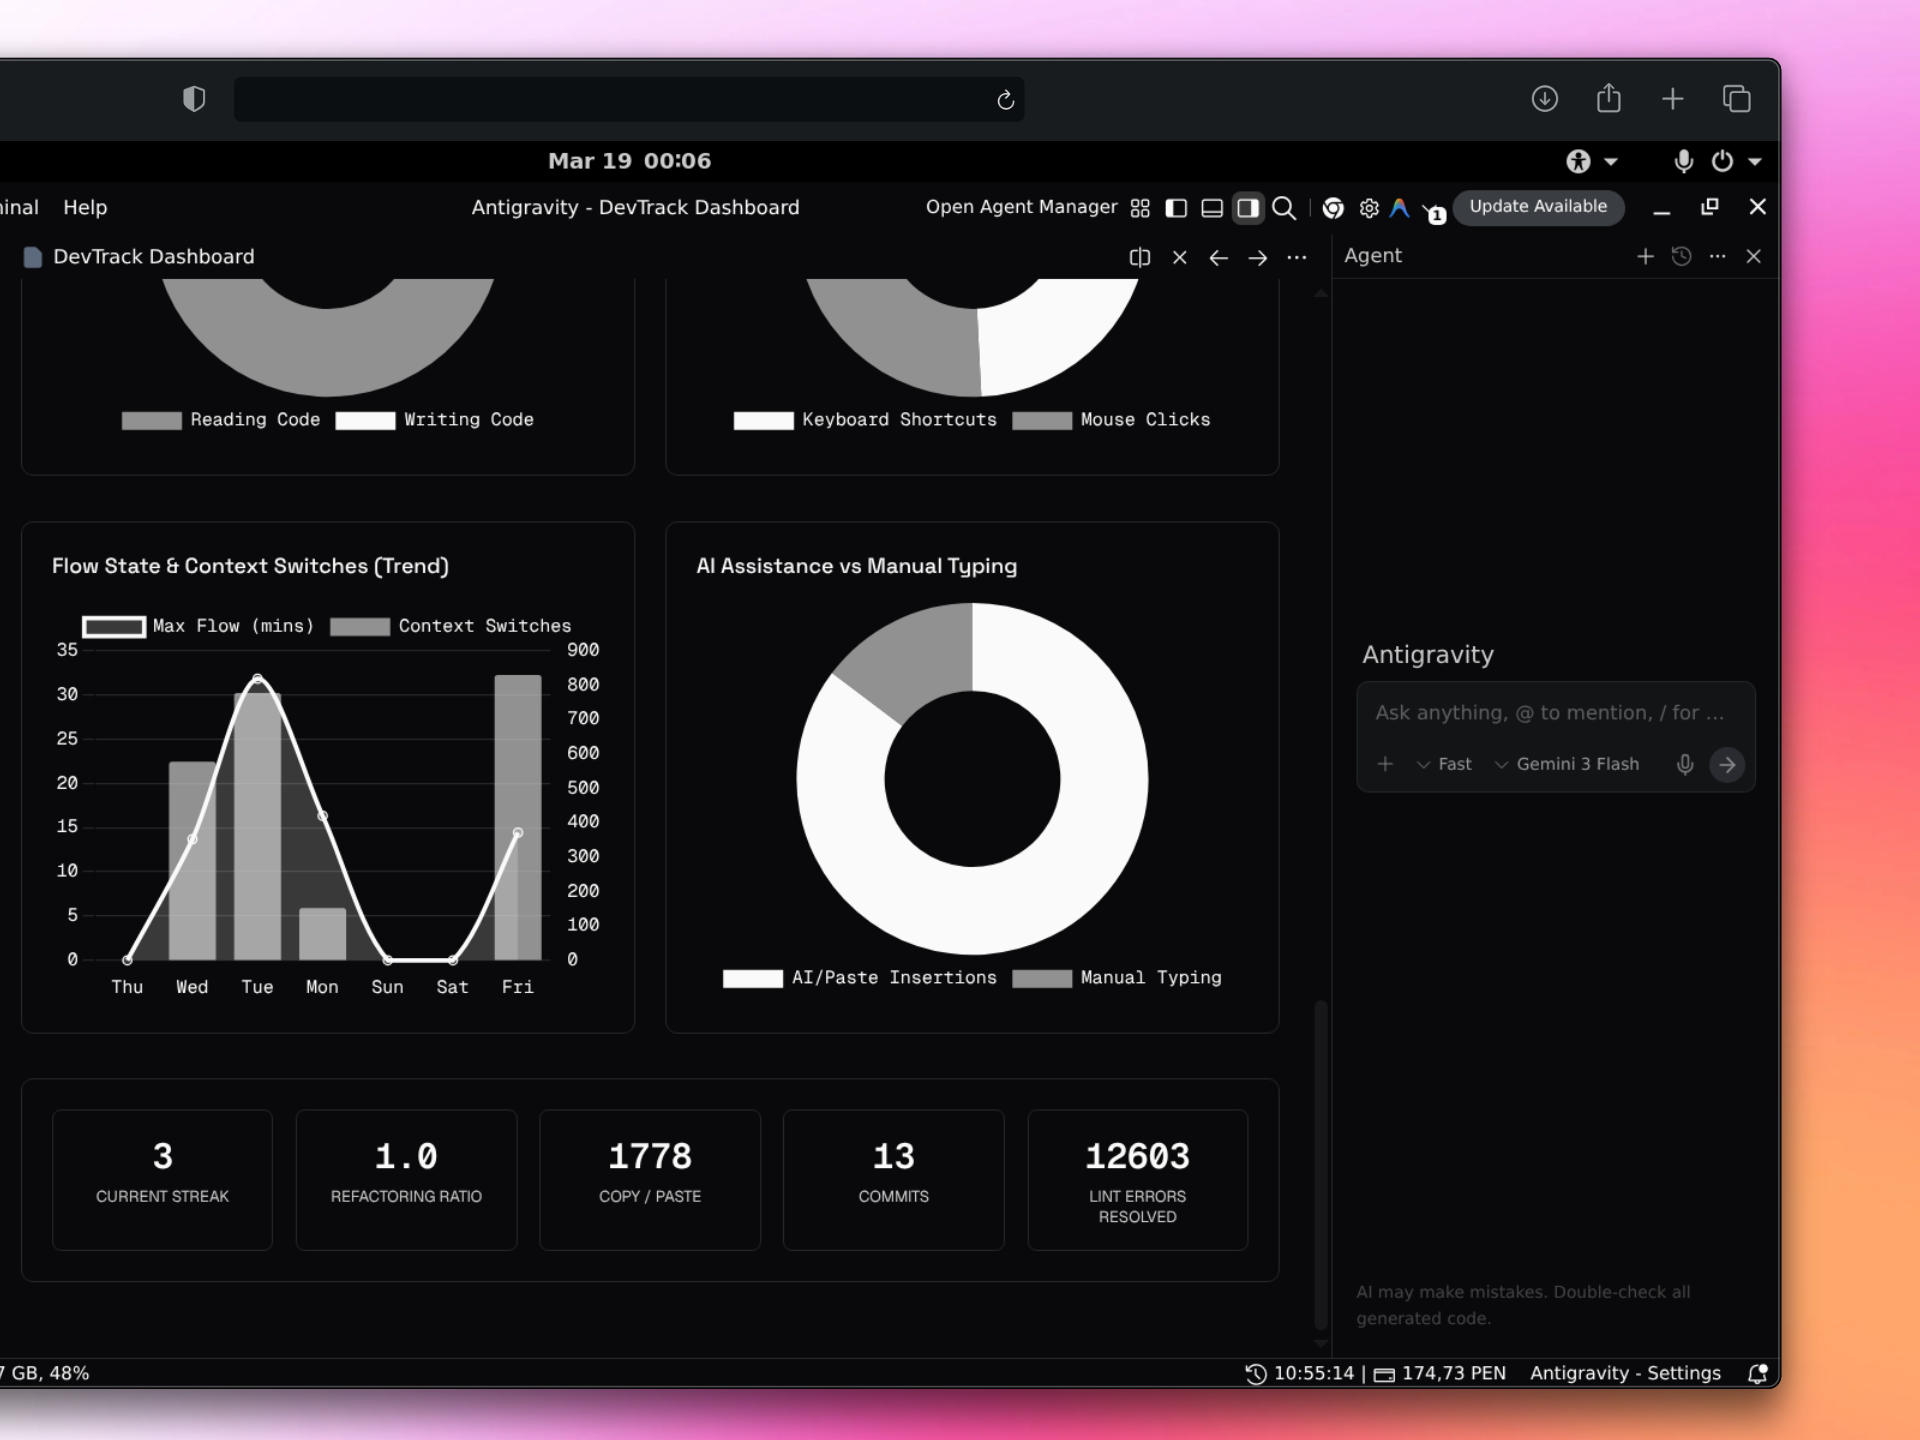
TimeActivityTracker: Accounts for the session based on a rate (devTrack.hourlyRate) and dispatches financial events.FlowStateTracker: Calculates uninterrupted periods of pure activity.ContextSwitchTracker: Counts how many times the editor window is switched to measure focus loss.AIAssistanceTracker: Quantifies what percentage of the finalized code comes from manual typing vs automatic insertions (such as those generated by AI assistants).CommitTrackerandLintTracker: Monitor external operations by reading.git/logs/HEADlogs and consuming diagnostic events (onDidChangeDiagnostics), respectively.
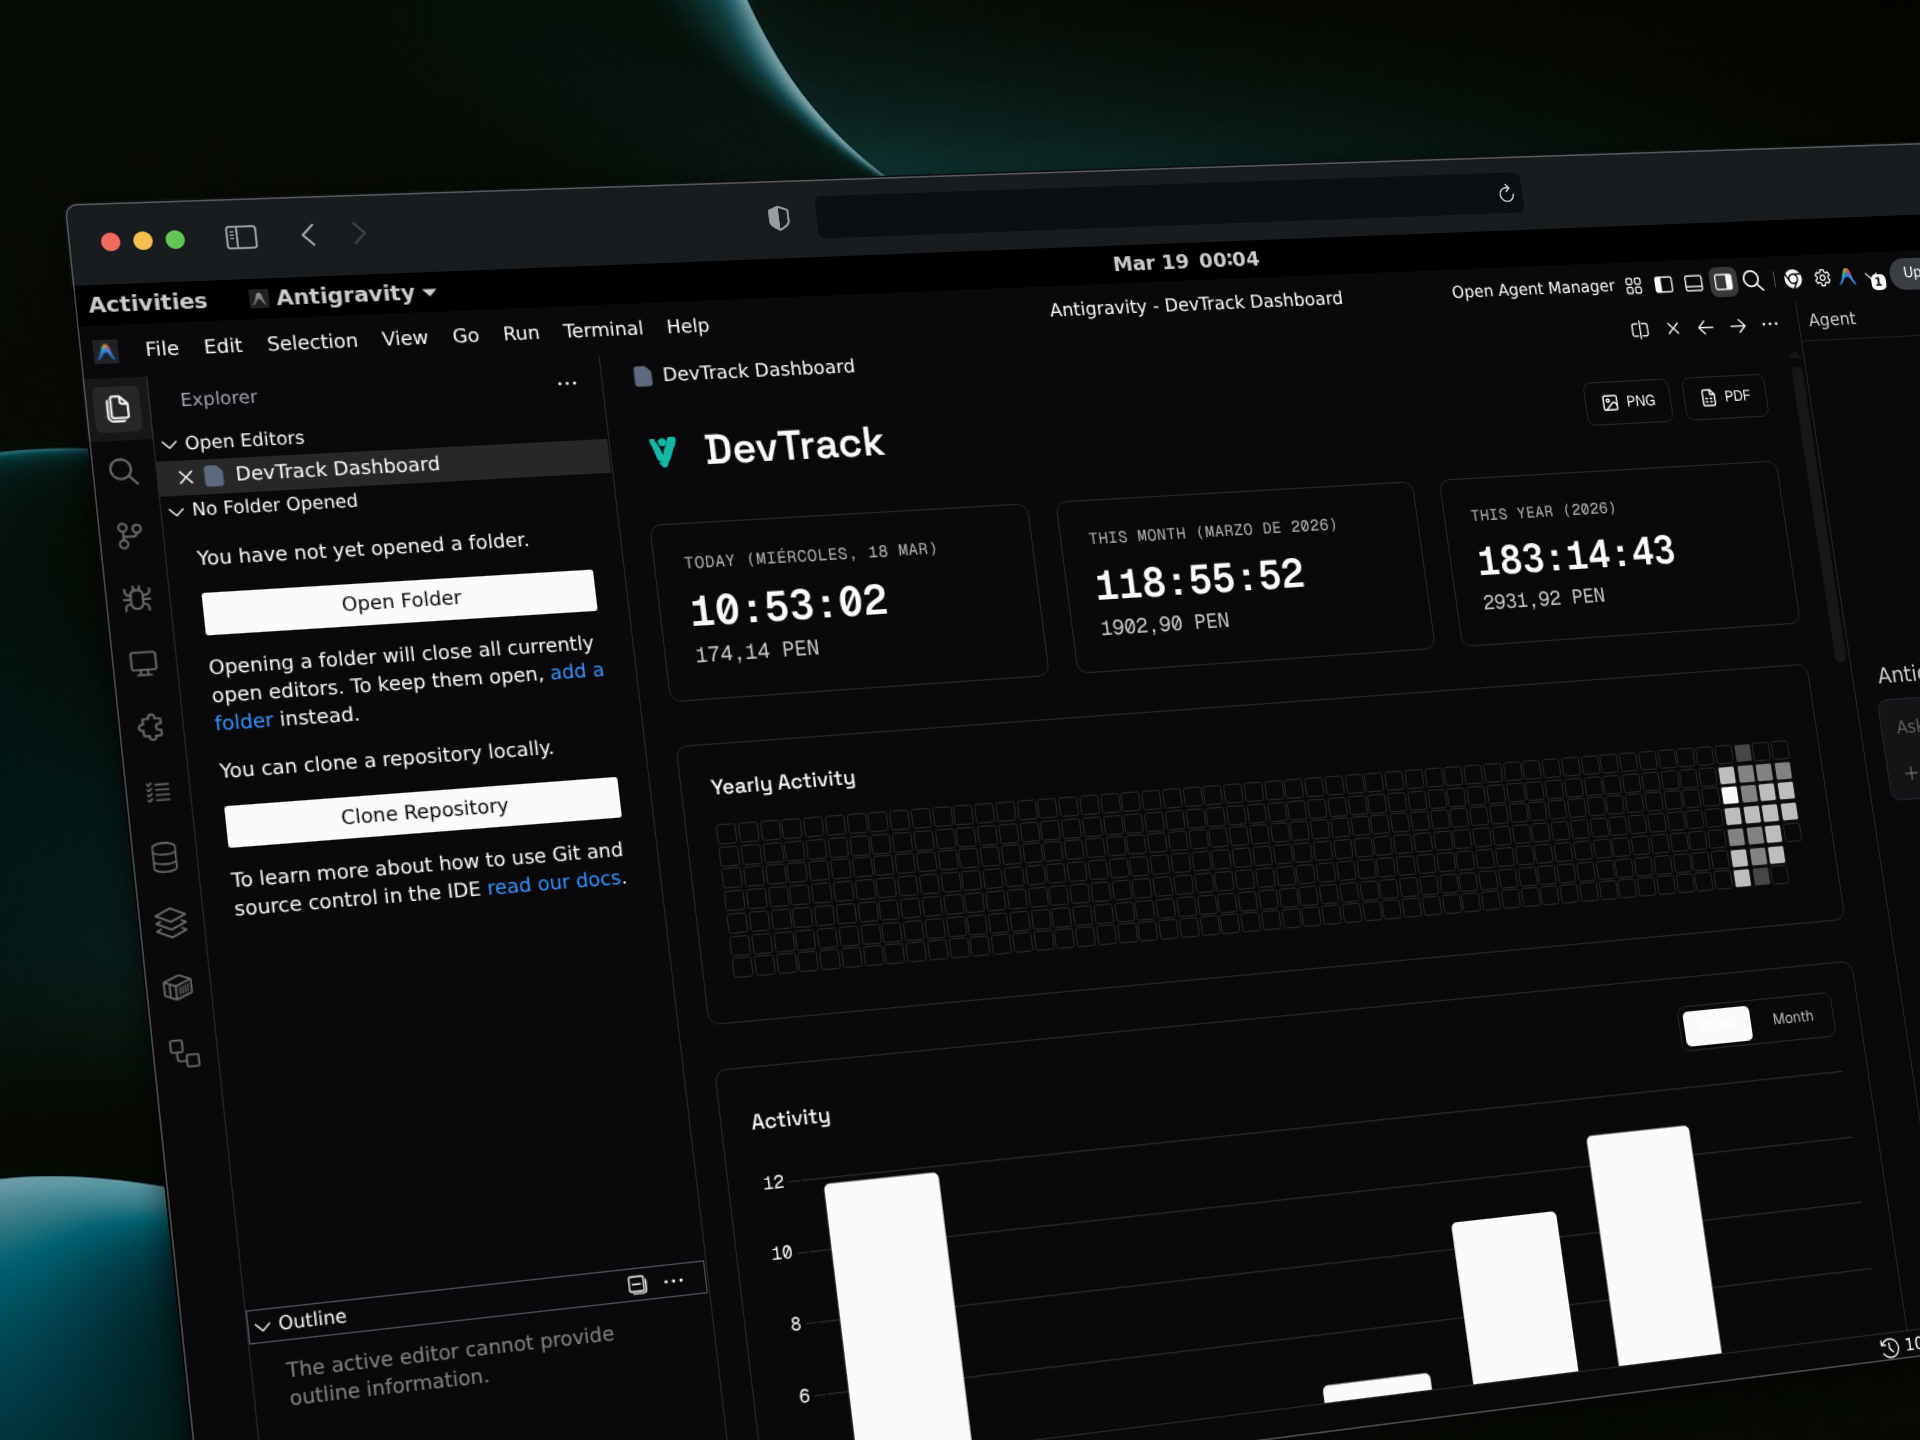
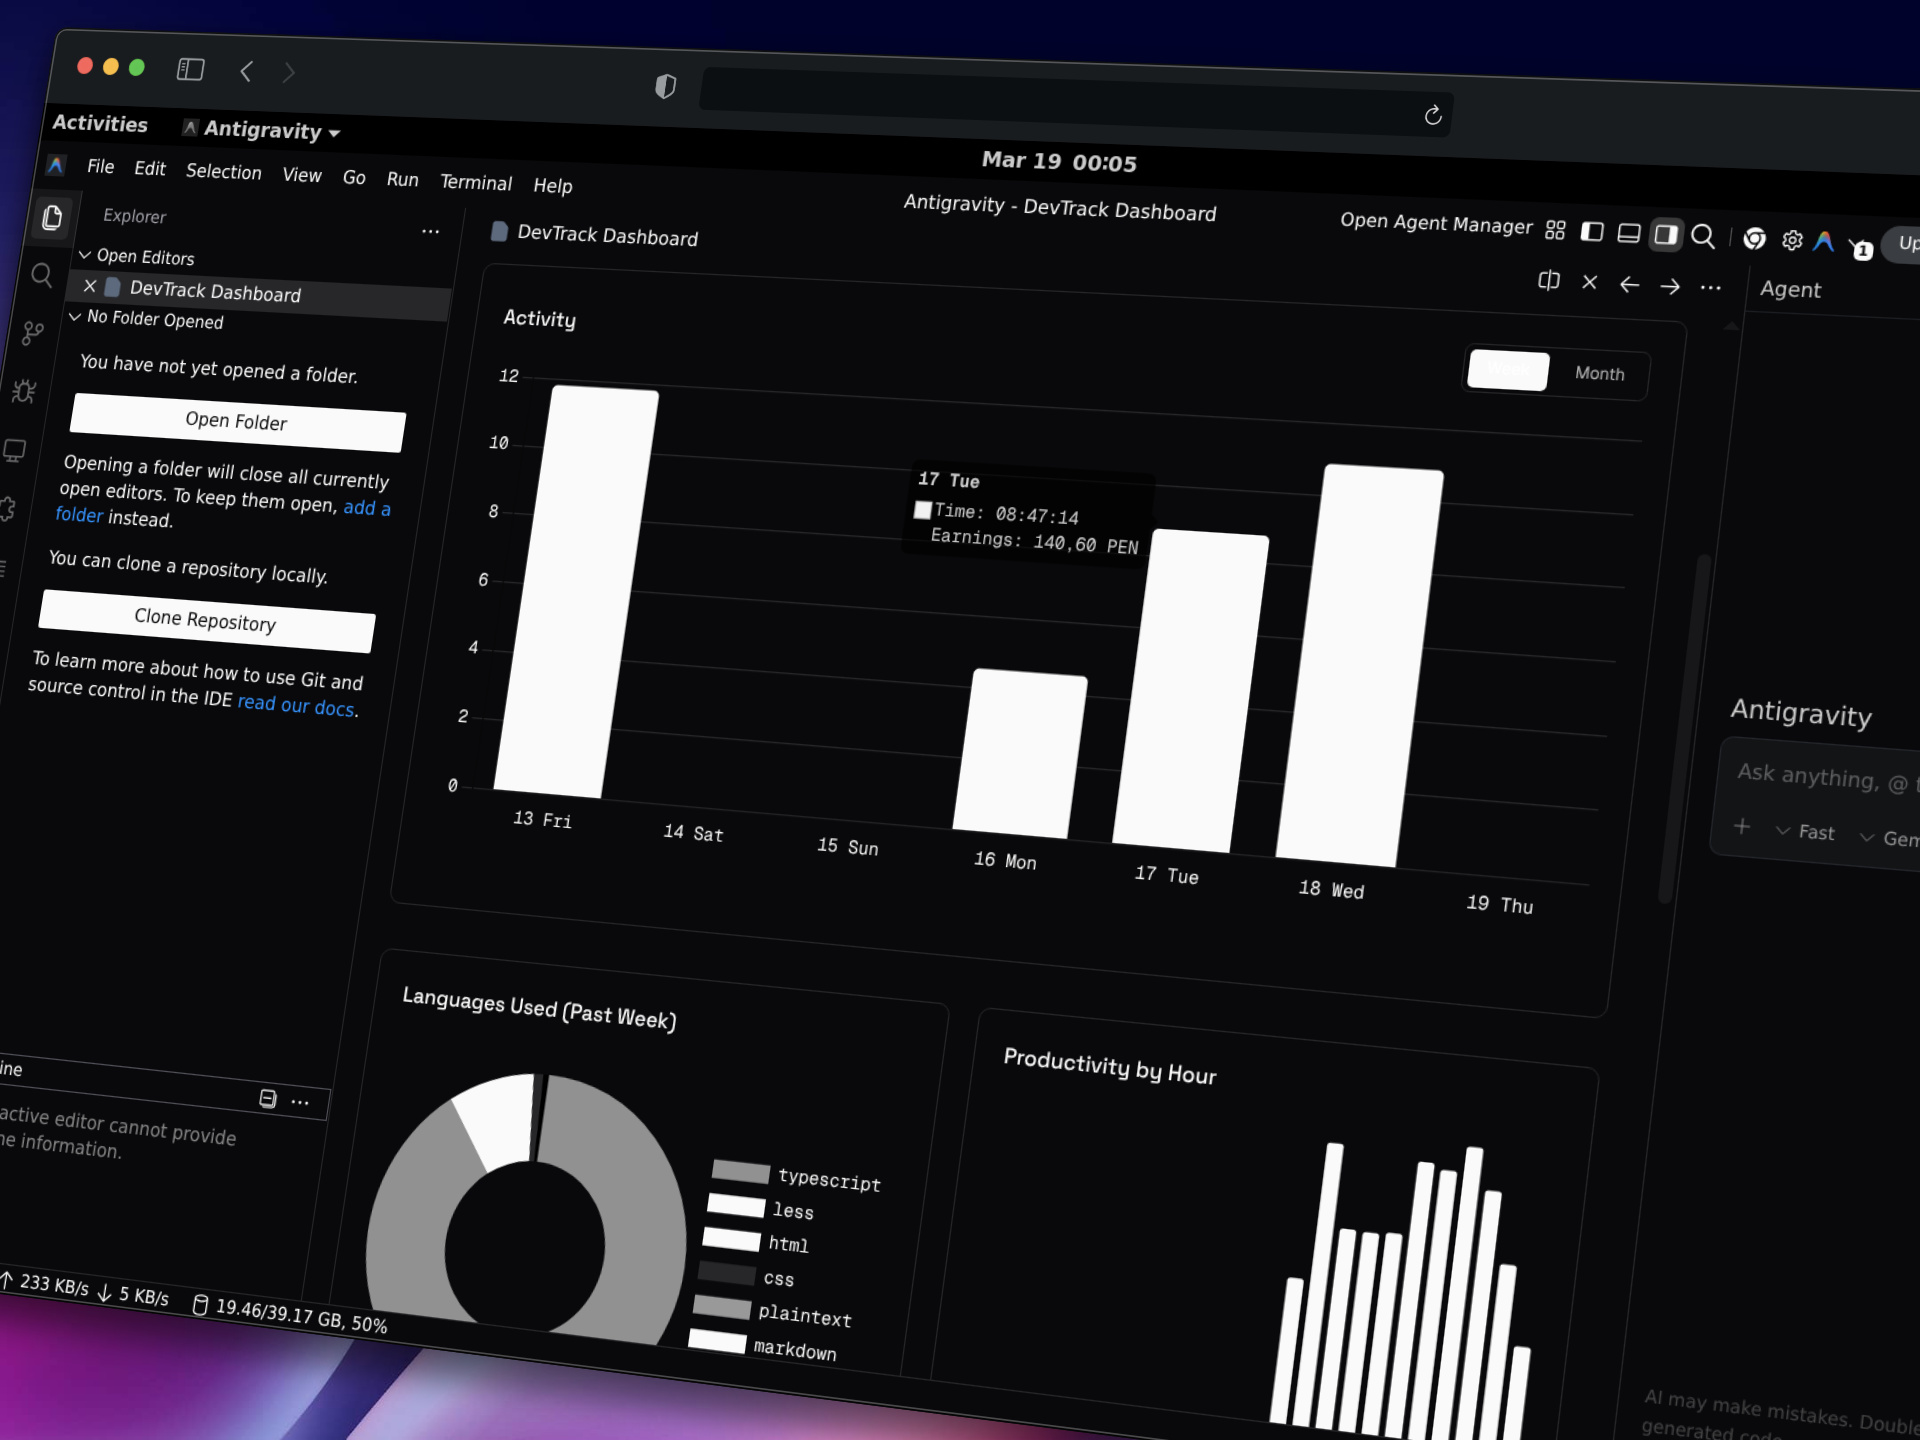
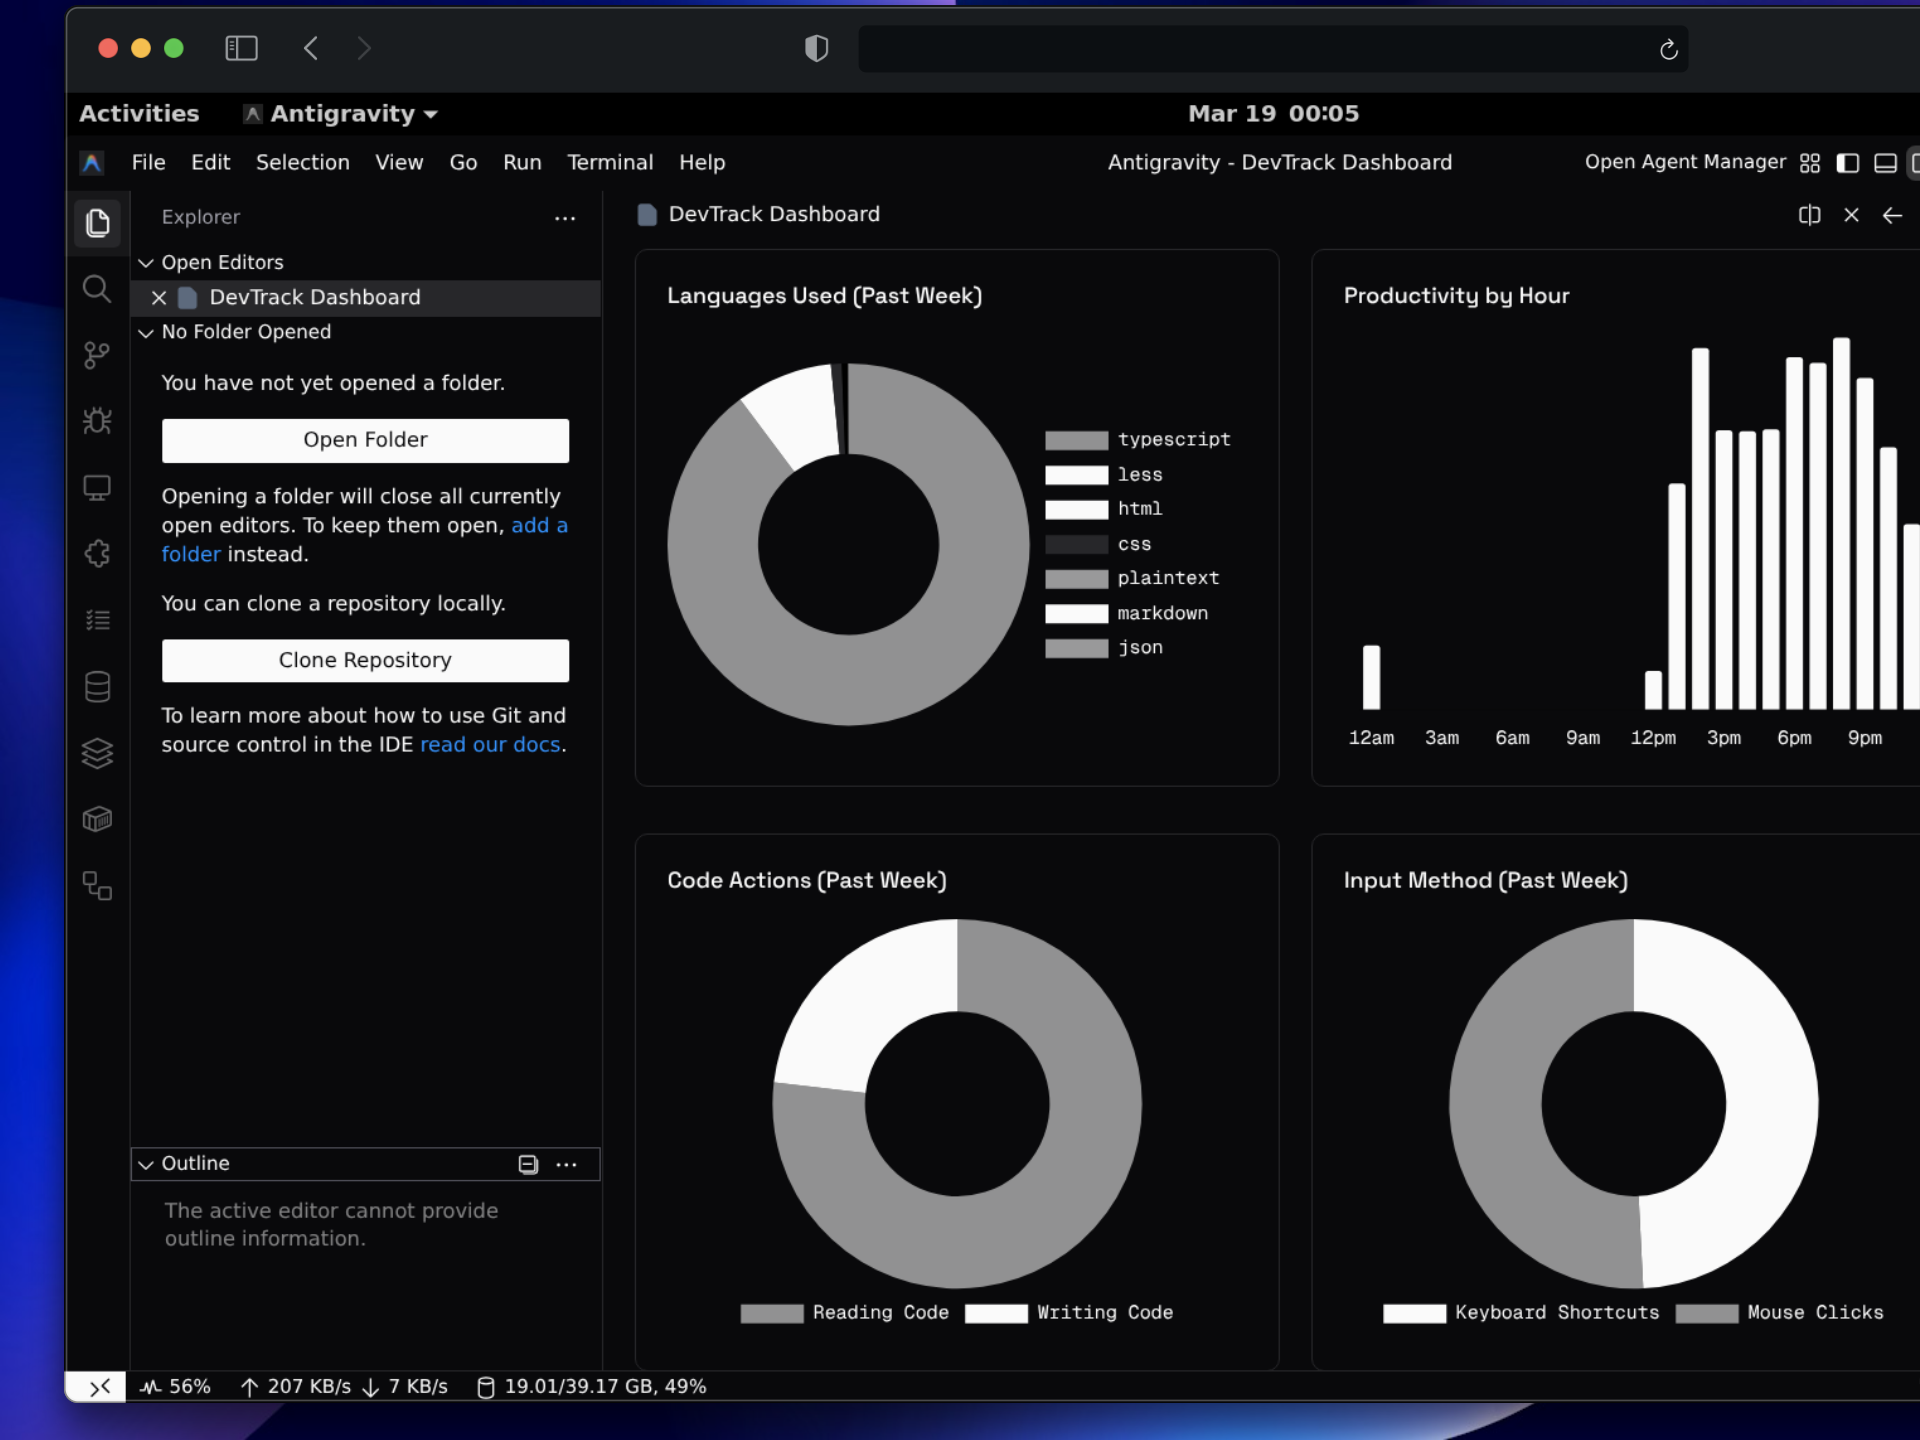
3. Data Visualization (The Dashboard)
For the client-side (inside the WebviewPanel), I avoided bundling large frameworks like React or Vue. I opted for native TypeScript rendering that injects pre-computed HTML.
For the metrics:
- I used Chart.js focused almost exclusively on greyscale doughnut charts.
- I implemented an annual heatmap (similar to GitHub’s) using a pure CSS Grid system instead of heavy charting libraries.
- I added support for PDF/Image report generation combining
html2canvasandjspdf, processing the DOM nodes on the client side and returning a downloadable Blob to the user via the Webview protocol.
4. Promotional Landing Page Stack
To showcase the project, I developed a fast presentation site (located in landing-page/). The main focus here was performance and SEO:
- Astro + React: Astro acts as the default “Zero-JS” engine, generating static HTML, while I encapsulated complex interactivity in React islands.
- Tailwind CSS v4: I used the new syntax via
@tailwindcss/postcss. The complete theme configuration (including dark mode support via the@custom-variant darkvariant) resides directly in the global CSS without requiring atailwind.config.jsfile. - Modern Iconography:
lucide-reactwas implemented to maintain a consistent, professional, and minimalist aesthetic across all site icons instead of using flat SVGs hardcoded into the code. - Optimization and PWA: The landing page features SEO configurations (including OpenGraph tags and images) and an initial
manifest.jsonto enable PWA capabilities. - Control Tools: Both the web and extension projects use Biome as the official linter and formatter to standardize the tab-based code convention.


